The Auto Trader Companion #5
What Is Up This Time?
– Updates On Bi Weekly Newsletter “My Auto Trader Companion”
– ForexGeometry (FGS) And ForexGeometry (FGS) Lite Similarities And Differences
– Uses Of ForexGeometry (FGS) Grouping Number And Name Of Trade
Updates On Bi-Weekly Newsletter “My Auto Trader Companion”
If you have been following us in our bi-weekly newsletter, our presentation format is through the use of a downloadable PDF format for easy reading at your own convenience and time.
But although it might provide some convenience, it does not allow you to provide easy and fuss-free feedback/ comments regarding the newsletter contents. Currently through our present format, we require you to send your feedbacks/comments through email so that we can get back to them.
The inconvenience by having to spend time to craft an email might bother you. Therefore it is best that we can publish our bi-weekly issues on our blog site so that you can access the issues easily and make any comments you have on the spot through the use of the comment feature.
Additionally, back issues of the bi-weekly newsletter will be available for viewing and commenting as well. The comments/feedbacks you make can be view by your fellow users of ForexTrailer/Geometry or other subscribers, therefore exchanges of constructive thoughts and ideas are welcome.
The publication of “The Auto Trader Companion” on our blog will be up as soon as we are done, so the link address to the latest issue will be provided in our email when we publish for the week.
We will announce the details soon so stay tuned.
ForexGeometry (FGS) And ForexGeometry (FGS) Lite Similarities And Differences
In our last bi-weekly issue, we have shared with you the availability of FGS Lite if you are a current user of ForexTrailer (FXT). FGS Lite can be used together with FXT in planning multi-staged exits from existing position of your trade in which the current FXT capability is unable to.
We have users who have asked us what is the difference between FGS and FGS Lite?
So we start off by saying the similarities of FGS and FGS Lite:
1) Both the FGS and FGS Lite use your plotted trendlines on your chart to determine your trade exits which is indicated by you.
2) Perform multiple partial closes (PCs)
3) Perform Stop-Loss-To-Break-Even (SLBE) +Npips levels where N is the number of pips from the entry price you wish stop loss is shifted to. You can also have multiple SLBE set up to allow your stop loss to “trail” at a certain number of pips when market price hits your drawn trendline each time.
Meaning let’s say you want your 1st SLBE target to be 20 pips in profit from the entry, you want your stop loss to shift to 5 pips more than your entry price and subsequently you also have a 2nd SLBE target at 40 pips in profit from your entry, you want your stop loss to further shift to 10 pips more than your entry price (which is 5 pips more than the current stop loss level), you can do that now.
This is also what I meant by “trail”.
4) You can have sloping trendlines as your PCs and SLBEs instead of just the usual horizontal price levels.
The difference between FGS and FGS Lite :
FGS Lite is a toned down version of FGS and free to our existing users of ForexTrailer who manage their trades for exits.
While FGS being a full version, is an entry and exit tool using trendlines to automatically execute your trade commands associated with the trendlines as set up by you.
FGS can:
1) Draw any lines to be your pending order entry (including sloping trendlines)
2) Draw any trendline to be your take profit level, stop loss
3) Define active trade session through vertical boundaries
4) Able to perform option to cancel order (OCO)
5) Able to use as a signal tool when market price hits your drawn trendlines
6) Indicator filtering tool to only enable entry based on certain conditions
7) Entry based on indicators charts
These features are what FGS Lite do not have.
FGS Lite is only available for current paid users ForexTrailer Silver Edition absolutely at no charge for their support these 2 years.
Uses of ForexGeometry (FGS) Grouping Number and Name Of Trade
For our FGS users, there have been some confusion or queries about the Group Number and Name Of Trade which they encounter when using FGS.
Here we will address this matter so that you can be clear of their functions.
Name Of Trade
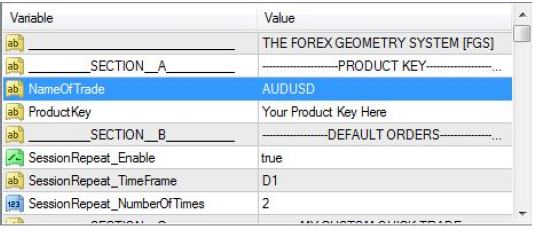
Name Of Trade is a parameter in FGS EA properties that users have to mandatory set so that FGS can recognize the currency pair it is handling.

Figure 1
Here you can see in figure 1 showing the EA properties box, there is a parameter “Name Of Trade” where users have to input the currency pair name. In this case, as we have attached FGS to a AUDUSD chart so therefore, we name the parameter AUDUSD as well to avoid confusion. (If EURUSD, name the parameter as EURUSD, this applies to other currency pairs as well)
If you are trading multiple AUDUSD trades (eg. 3 trades on AUDUSD) with FGS, it is Advisable to set up 3 charts of AUDUSD with FGS attached to each AUDUSD chart.
Then you will label each FGS profile “Name Of Trade” as AUDUSD1, AUDUSD2, AUDUSD3 respectively on each chart. This is to allow you identify the individual trades easily without confusion that may arise from the multiple trendlines drawn by you on a single chart.
Group Number
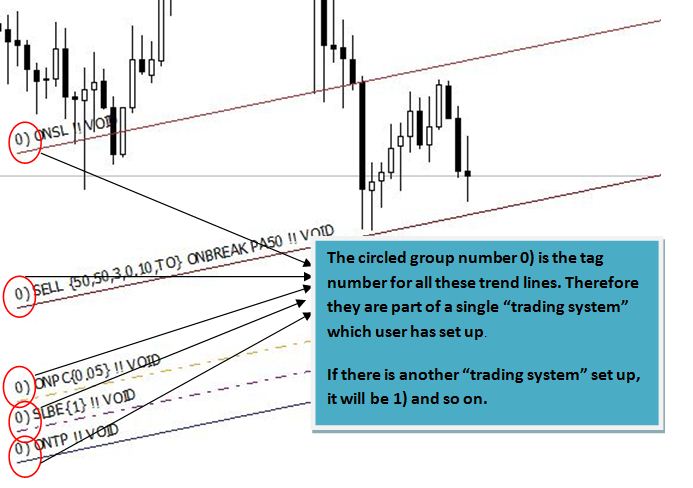
Group number is the tag number of each trendline which groups all related trendlines together so that they work seamlessly as one.

Figure 2
In figure 2, what this means is that when you set up FGS to trade a particular system (from stop loss, entry, partial close, SLBE and take profit), they must be grouped together with a common tag number to recognize that they belong to the same “trading system”. So that when the trade entry is made through the entry trendline, all the associated trendlines will in tandem adjust itself to the same trade order number to work as a trade system.
(Note: This is very important as if the Group Number on the other trendlines are different from the entry trendline, they will not work together, instead you will just have only the entry trendline working.)
If you have set up multiple trade systems in 1 chart, you can identify them through the group number associated with them in the beginning of the FGS GeoLingo. Eg. 0), 1), 2) …
This grouping number is useful when instead of opting to have multiple trade profiles (“Name Of Trade”) set up across multiple charts when having multiple trades on the same currency pair.
So through the grouping number, you can identify easily which trendline belongs to which particular group.
Do drop us your comments below for this issue of the Auto Trade Companion to share your views and thoughts.
Your feedback is most appreciative.
We hope that you have a great week ahead and good luck trading!
For more information on ForexTrailer & ForexGeometry:
http://www.ForexTrailer.com/Special-Offer.html
http://www.ForexGeometry.com/Special-Offer.html
Regards,
Warren Seah and the ForexTrailer/Geometry Team
Copyright ©2012 ForexTrailer.com & ForexGeometry.com
NOTE: ANY INFORMATION CONTAINED IN THIS DOCUMENT IS FOR EDUCATIONAL PURPOSES ONLY AND IS NOT FINANCIAL ADVICE.
U.S. GOVERNMENT REQUIRED DISCLAIMER – COMMODITY FUTURES TRADING COMMISSION FUTURES, CURRENCY AND OPTIONS TRADING HAS LARGE POTENTIAL REWARDS, BUT ALSO LARGE POTENTIAL RISK. YOU MUST BE AWARE OF THE RISKS AND BE WILLING TO ACCEPT THEM IN ORDER TO INVEST IN THE FUTURES AND OPTIONS MARKETS. DON’T TRADE WITH MONEY YOU CAN’T AFFORD TO LOSE. THIS IS NEITHER A SOLICITATION NOR AN OFFER TO BUY/SELL FUTURES OR OPTIONS. NO REPRESENTATION IS BEING MADE THAT ANY ACCOUNT WILL OR IS LIKELY TO ACHIEVE PROFITS OR LOSSES SIMILAR TO THOSE DISCUSSED ON THIS WEB SITE. THE PAST PERFORMANCE OF ANY TRADING SYSTEM OR METHODOLOGY IS NOT NECESSARILY INDICATIVE OF FUTURE RESULTS. CFTC RULE 4.41 – HYPOTHETICAL OR SIMULATED PERFORMANCE RESULTS HAVE CERTAIN LIMITATIONS. UNLIKE AN ACTUAL PERFORMANCE RECORD, SIMULATED RESULTS DO NOT REPRESENT ACTUAL TRADING. ALSO, SINCE THE TRADES HAVE NOT BEEN EXECUTED, THE RESULTS MAY HAVE UNDER-OR-OVER COMPENSATED FOR THE IMPACT, IF ANY, OF CERTAIN MARKET FACTORS, SUCH AS LACK OF LIQUIDITY. SIMULATED TRADING PROGRAMS IN GENERAL ARE ALSO SUBJECT TO THE FACT THAT THEY ARE DESIGNED WITH THE BENEFIT OF HINDSIGHT. NO REPRESENTATION IS BEING MADE THAT ANY ACCOUNT WILL OR IS LIKELY TO ACHIEVE PROFIT OR LOSSES SIMILAR TO THOSE SHOWN.
